An epic narrative of the ancient history and civilization of Persia (Iran); a story of a nation that, like the...
Radio-Frequency Electromagnetic Field Exposure of Western Honey Bees
Abstract
Radio-frequency electromagnetic fields (RF-EMFs) can be absorbed in all living organisms, including Western Honey Bees (Apis Mellifera). This is an ecologically and economically important global insect species that is continuously exposed to environmental RF-EMFs. This exposure is studied numerically and experimentally in this manuscript. To this aim, numerical simulations using honey bee models, obtained using micro-CT scanning, were implemented to determine RF absorbed power as a function of frequency in the 0.6 to 120 GHz range. Five different models of honey bees were obtained and simulated: two workers, a drone, a larva, and a queen. The simulations were combined with in-situ measurements of environmental RF-EMF exposure near beehives in Belgium in order to estimate realistic exposure and absorbed power values for honey bees. Our analysis shows that a relatively small shift of 10% of environmental incident power density from frequencies below 3 GHz to higher frequencies will lead to a relative increase in absorbed power of a factor higher than 3.
Introduction
Wireless communication is a widespread and growing technology. Most of the wireless networks and personal devices operate using Radio-Frequency (RF) electromagnetic fields (EMFs). The current networks rely on frequencies between 0.1 GHz and 6 GHz1. These EMFs can be absorbed in dielectric media and can cause dielectric heating2. This dielectric heating can occur in any living organism, including insects.
Absorption of RF EMFs in insects has been studied previously. Wang et al.3 studied absorption of RF EMFs in mashed codling moth larvae at 27 MHz and 915 MHz. Shrestha et al.4 studied dielectric heating of Cryptolestes ferrungineus S. in different stages (eggs, larvae, pupae, and adults) at 27 MHz. Shayesteh et al.5 exposed Tribolium confusum and Plodia interpunctella to RF EMFs at 2450 MHz6,7,8. are reviews of RF heating of insects. Dielectric porperties of insects are measured by Nelson et al.9 from 0.2 to 20 GHz through the determination of loss of RF EMF power in insect samples (rice weevil, red flour beetle, saw-toothed grain beetle, and lesser grain borer). Absorption of RF EMFs was studied by Halverson et al.10 in insects between 10–50 GHz. Thielens et al.11 used numerical simulations to study absorption of RF EMFs from 2–120 GHz in four insect models. The main conclusions from the aforementioned studies are that (i) RF EMFs can be absorbed and can cause dielectric heating in insects and (ii) this absorption of RF-EMFs is frequency dependent. This frequency dependency is important since 5th generation (5 G) networks are expected to partially operate at higher frequencies (up to 300 GHz)12,13. This shift might induce a change in RF EMF absorption for insects11.
Western Honey Bees (Apis Mellifera) are particularly important insects because of the environmental and economical importance of this species. Therefore, previous studies have focused on the potential effects of EMF exposure of Western Honey Bees. Low-frequency EM properties and exposure of honeybees was studied in14. The influence of Low-frequency magnetic fields on honey bee orientation has been studied in15. There have also been some studies on effects of RF EMF on honey bees. Potential effects of RF EMF exposure on reproduction of honey bee queens were investigated in16. Behavioral effects potentially caused by exposure to RF EMFs in honey bees have been investigated in17,18,19. A disadvantage is that these studies are lacking a quantification of the amount of power that is absorbed in the studied honey bees, so called RF dosimetry20. On the other hand, this absorption has been determined for a single honey bee worker in11. However, Thielens et al.11 do not provide any coupling of this absorption to a real RF-EMF exposure situation and only study a single honey bee, which provides no information on the evolution of such absorption as a honey bee goes through different developmental stages. Nor is it clear whether this RF absorption is realistic for other castes, such as drones or queens, in a bee colony.
Therefore, the aims of this study were to numerically evaluate RF-EMF absorption in western honey bees and validate the frequency dependency of this absorption during various developmental stages and experimentally quantify real-life exposure of bees. To this aim, numerical simulations were executed to determine the absorption of RF-EMFs in five different honey bee models: a larva, a queen, two workers, and one drone, obtained using micro-CT imaging. These simulations were implemented as a function of frequency in a broad band, 0.6 GHz up to 120 GHz, that can be used to model both current and future telecommunication frequencies. In parallel, RF-EMF exposure measurements were executed near five bee hives in Belgium, in order to quantify the real exposure of such honey bees. Finally, these measured values were used to rescale the numerical simulations in order to quantify real honey bee absorption and assess a potential change in absorption in case a shift in operation frequencies in future telecommunication networks would occur.
Methods
Studied honey bees, imaging technique, and model development
Images of the studied insects are shown in Fig. 1. All studied insects are western honey bees (Apis mellifera), which is the most commonly used honey bee worldwide. Honey bees within a colony are subdivided into different castes. An active viable honeybee colony contains only one queen bee who spends most of her time laying 2,000 to 3,000 eggs per day. The queen is the only reproductive female within the colony and her health is vitally important to the survival of her colony. Damage to her ovaries has the potential to effect the function and survival of her progeny. A queen typically lives between approximately three and five years. From early spring time to mid-summer the queen lays unfertilized “haploid” eggs which develop into drone bees. All drones are males. Their specific role is to mate with a virgin queen so that she can initiate the propagation of a new colony. During this mating season, there are approximately 3,000 to 5,000 drones within any given colony. Drones typically live between one to two months.
Studied Honey Bee Models, from top to bottom: Male Drone, Worker Bee 1, Worker Bee 2, Worker Larva and Queen Bee. Columns show different perspectives: back, front, left, top, and bottom view, respectively. The white lines show a 1 mm scale for reference.
A healthy honey bee colony can contain approximately 50,000 individuals. Most of these are sterile, female, worker bees. Worker bees perform all the tasks within a colony to keep it full of provisions and free from disease. This involves feeding and nursing larvae, foraging for nectar and pollen, storing nectar and pollen, guarding the entrance, tending to the hygiene of the queen-workers-drones and maintaining a clean hive environment. Workers live for three to four weeks during the active seasons (spring-summer-autumn) and approximately three months during the colder inactive season (winter). There are approximately 3,000 (winter) to 10,000 (summer) larvae present at any given time.
We chose representatives from all three castes within a honeybee colony, one queen bee, two worker bees, one drone bee and one worker larva. All honey bees were scanned at the Western Sydney University National Imaging Facility (Sydney, Australia) using a bench-top MicroCT scanner (Quantum GX MicroCT Imaging System, PerkinElmer, Hopkinton, MA, USA). The parameters used during this scanning depended on the scanned bee. Such scans are made using different projections, at different time intervals on the scanners settings. The rotation between projections also depends on the scanner’s settings and the studied honey bee (see below for full description).
Worker 1
The insect named ‘Worker 1’ is the same bee studied in11, which had a full body length of approximately 11.0 mm long, is 5.0 mm wide, and had a mass of approximately 900 mg. During the scanning of Worker 1, the Micro-CT scanner was operated using the following parameters: 50 kVp, 80 mA, and a 2048 × 2048 pixels image matrix. This resulted in scans with a 20 μm isotropic voxel size. Each projection had a scanning time of 3.0 s, with 3.0 s rotation time in between projections. The total scan time for Worker 1 was approximately 18 min.
Worker 2
The second honey bee worker (Worker 2) has a full body length of 13 mm with cross sectional dimensions of 6.8 mm and 5.4 mm and a mass of approximately 900 mg. For Worker 2, the scanner was operated using the following parameters: 40 kVp, 70 mA, and a 2048 × 2048 pixels image matrix. The isotropic voxel size was 100 μm. Each projection had a scanning time of 1.5 s. There was a 3.0 s rotation time in between each projection. The total scan time for the whole bee was approximately 10 min.
Larva
Larvae of this age (three weeks) are typically approximately 16 mm long with an approximate mass of 900 mg. The scanned larva was curled up, which made estimating its full body dimensions difficult, but the sample fitted within a 14 × 7 × 15 mm3 box. This scanning of the larva was done using the following parameters: 50 kVp, 80 mA, and a 2048 × 2048 pixels image matrix. This resulted in scans with a 20 μm isotropic voxel size. Each projection had a scanning time of 3.0 s. and with a 3.0 s rotation time this resulted in a total scan time for the larva of 18 min.
Male drone
The drone has a full body length of 18 mm with cross sectional dimensions of 7.2 mm and 9.4 mm and an approximate mass of 1 g. During the scanning of the drone, the Micro-CT scanner was operated using the following parameters: 40 kVp, 70 mA, and a 2048 × 2048 pixels image matrix. The isotropic voxel size was 100 μm. Each projection had a scanning time of 1.5 s. The full scan took 180 projections and there was a 3.0 s rotation time in between each projection. The total scan time for the whole bee was approximately 10 min.
Queen bee
The QB has a full body length of 19 mm and cross sectional dimensions of 7.5 times 7.1 mm2 and an approximate mass of 1100 mg. The queen was scanned was using the following parameters: 40 kVp, 70 mA, and a 2048 × 2048 pixels image matrix. The isotropic voxel size was 250 μm. Each projection had a scanning time of 1.5 s. There was a 1.5 s rotation time in between each projection. The total scan time for the queen bee was approximately 10 min.
Development of 3D models
The software running on the Quantum GX, bench-top MicroCT scanner was used for all honey bees to reconstruct the 180 projection images. Those were then converted into a 2D rendered image stack of 512, 16 bit bitmap images. Finally, the BeeView volume rendering software (DISECT Systems Ltd, Suffolk, UK) was used to acquire Bee volume data from the image stack. All 3D models of the insects were created using the software TomoMask (www.tomomask.com). We used the same approach as in11. The image stack for each honey bee was imported into TomoMask, which also required the pixel and slice spacing. The software generated a 3D model using a marching cubes algorithm21. This model was then exported as an STL (STereo Lithography)22 file. This is a commonly used format to describe surface geometry. The models were also smoothed using the Taubin λ/μ smoothing scheme23 implemented in MeshLab24. The dimensions of the models and mesh integrity were checked (and corrected if necessary) before simulations using Netfabb (Autodesk, San Rafael, CA, USA).
Numerical simulations and RF EMF exposure conditions
Electromagnetic, numerical simulations were executed to estimate electromagnetic fields in and around the honey bees under far-field exposure. Far-field exposure is in this manuscript defined as RF-EMF sources being more than 2D2/λ away from the insects, with D the largest dimension of the RF source and λ the wavelength of the RF-EMFs. This is often referred to as the Fraunhofer far-field limit25. In general, far-field RF-EMF sources can be located in any direction from the honey bees. Therefore, different approaches exist to model such far-field exposure to RF-EMFs: a stochastic method where far-field exposure is decomposed in sets of plane waves according to certain statistics is used in26,27, while a more limited set of plane-wave exposures coming from six predefined directions along the main axis of the exposed subject or animal are considered in11,28. In this study, we have chosen to work with the latter method. We have modeled exposure of the studied honey bees by a set of 12 incident plane waves traveling along six directions defined by a Cartesian coordinate system, see Fig. 2. For each direction, two orthogonal incident electric field polarizations were chosen, since any other free-space E-field polarization can be obtained using a linear combination of both. All incident plane waves have a root-mean squared electric field strength of 1 V/m. This value is chosen to facilitate renormalization to any potential value of incident field strenght.
Configuration of the RF-EMF plane-wave simulations. Twelve potential RF plane waves incident from six directions are incident on the insect (honey bee drone shown here in grey, top view). Orange arrows indicate the electric field E¯¯¯¯iE¯i polarizations, while the black arrows indicate the direction of propagation with wave vector k¯¯¯i/jk¯i/j of the plane waves. i and j indicate the simulations’ configuration number, from 1 to 12.
Numerical simulations were executed using the Finite-Difference Time-Domain (FDTD) method implemented in Sim4life (ZMT, Zurich, Switzerland). This is a common technique used to determine RF-EMF in and near homogeneous and heterogeneous dielectric objects11,26,28, such as the honey bees studied in this paper. In this method, the simulation domain is divided in cubes using a three-dimensional rectilinear grid. Depending on the wavelength, feature sizes of the objects in the simulations, and the desired spatial accuracy, a different spatial step is used to discretize the simulation. The FDTD algorithm requires a grid step smaller than one tenth of the smallest wavelength in the simulation domain in order to return stable solutions29. Since this is a time-domain technique, it requires a predefined simulation time in order to reach a steady-state solution, which will again depend on the chosen spatial resolution, the wavelength, and the size of the simulation domain.
We executed numerical simulations at nine harmonic frequencies from 0.6–120 GHz (sinusoidal waves at a single frequency). The lower and upper frequency limits were chosen because they correspond to the current limits in terms of simulation size and length that can realistically be supported by our simulation hardware. The simulated frequencies are listed in Table 1 alongside the chosen grid steps in the simulation domain and the number of periods used for every simulation. These settings were the same for each of the five studied honey bee models. The studied insects have certain dielectric properties, quantified using the relative permittivity (εr) and conductivity (σ). We did not measure the dielectric properties of the studied insects. Instead, we assigned dielectric parameters obtained from11. The value at 1 GHz is obtained using the same literature database and interpolation presented in11. Table 1 lists these properties. All insects were modeled as homogeneous objects. These configurations resulted in 12 (plane waves) × 9 (frequencies) × 5 (honey bees) = 540 simulation results.
Table 1 Simulations Settings and Dielectric Properties of the Honey Bees.Full size table
After each simulation, the internal electric field in the insect model was extracted and used to calculate the total absorbed RF-EMF power (Pabs) in the honey bee. Pabs is calculated as the integrated product of the conductivity and the squared internal electric field strenght (E¯¯¯¯intE¯int) over the total volume (V) of the insect:
Pabs=∫Vσ×|E¯¯¯¯int|2.dVPabs=∫Vσ×|E¯int|2.dV(1)
We report Pabs rather than specific absorption rate (SAR) values since we did not measure the mass and density of all the simulated honey bees. Pabs is an important quantity since dielectric heating of an insect is proportional to absorbed RF-EMF power2.
In order to validate our simulations we tested the influence of four simulation settings on the RF-EMF Pabs: grid step size, dielectric parameters, angle of incidence, and number of simulated periods. The influence of the grid step is expected to be the most significant at the highest simulated frequency (120 GHz), since the chosen maximal grid step of 0.05 mm is closest to the smallest wavelength in the simulation domain at that frequency in the tissue (0.05 mm = 0.045 λ). Therefore the maximal grid step was set to 25 μm for exposure configuration number 2 in Fig. 2 for both the Larva and Worker 2 phantoms. In11, it was demonstrated that the maximal uncertainty on the dielectric parameters occurs between 2 and 3 GHz, with maximal relative deviations of 40%. In order to test the dependency of our simulation results on the chosen dielectric parameters, we executed four additional FDTD simulations in exposure configuration number 2 shown in Fig. 2 using the Worker 2 phantom. In these simulations the dielectric parameters (ε,σ) were changed to: (1.5.ε, 1.5.σ), (0.5.ε, 1.5.σ), (1.5.ε, 0.5.σ), and (0.5.ε, 0.5.σ), respectively, allowing for a potential 50% deviation on the dielectric parameters, which should be larger than the uncertainty on the chosen dielectric parameters. We chose to model RF-EMF exposure of the studied honey bees using plane waves incident from 6 directions. However, it is uncertain whether this set of plane waves provides a complete overview of the full range in Pabs as function of the angle of incidence. In order to validate our exposure set up, we have executed 20 additional FDTD simulations at 6 GHz using the Worker 2 phantom, where the elevation, azimuth, and polarization angles were generated according to uniform distributions between [0, π], [0, 2π], and [0, 2π], respectively. The settings of these FDTD simulations were the same as those shown in Table 1. Finally, the number of simulated periods was tested at 120 GHz for the Worker 2 phantom in exposure configuration number 2 shown in Fig. 2 by increasing the number of simulated periods to 120 instead of 30, see Table 1. After each of these validation simulations, the Pabs was extracted and compared to the one obtained in the original simulation set.
RF-EMF field measurements
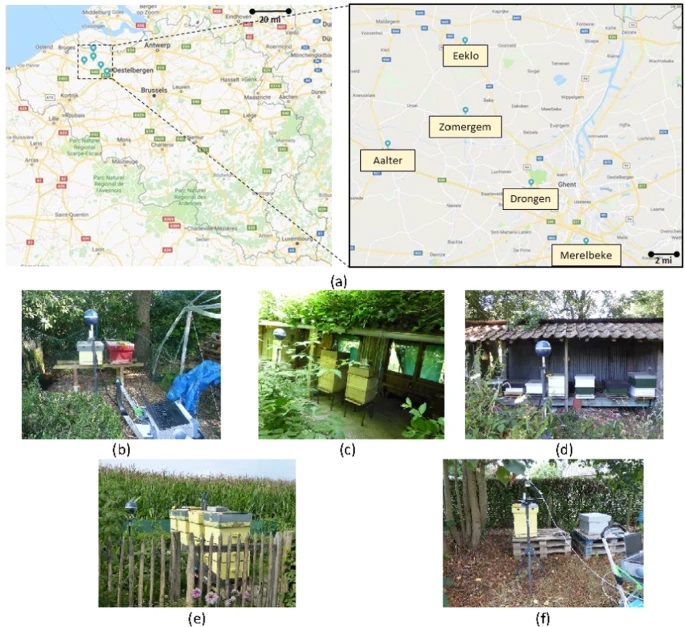
In order to quantify current RF-EMF exposure of honey bees in real exposure scenarios, we executed RF-EMF exposure measurements at five sets of bee hives in Belgium at: Aalter, Merelbeke, Eeklo, Zomergem, and Drongen, see Fig. 3(a). At each measurement site, three different measurements were executed in order to quantify RF-EMF exposure.
Five measurement locations near bee hives in Belgium: (a) Overview of the measrurement locations (source: https://www.google.com/maps, Google Maps, Google, Alphabet inc., Mountain View, CA, USA) Map data: Google, GeoBasis-DE/BKG (b) Aalter, (c) Merelbeke, (d) Eeklo, (e) Zomergem, and (f) Drongen.
First, a spectrum analyzer of the type FSL6 (R&S Belgium, Excelsiorlaan 31 1930 Zaventem Belgium) connected to a triaxial isotropic antenna was used to perform a broad-band RF overview measurement from 80 MHz to 6 GHz. These measurements were executed in two steps: first spectral overview measurements were executed from 0.08–3 GHz using a tri-axial antenna TS-EMF (Rhode and Schwartz, dynamic range of 1 mV/m–100 V/m for the frequency range of 80 MHz–3 GHz), followed by measurements from 3–6 GHz using a Clampco AT6000 antenna. At one out of five measurement sites, Drongen, a conical dipole antenna PCD 8250 (Seibersdorf Laboratories, Seibersdorf, Austria) was used for the 80 MHz - 3 GHz measurements. This antenna was rotated to obtain three orthogonal polarizations of the electric field. During these overview measurements, the spectrum analyzer measured in maximum-hold modus during 17 and 9 minutes in the lower and higher frequency bands, respectively. The antennas were supported by a plastic tripod and were placed at 1 m in front of the bee hive at a height of 1.5 m from the ground level. Figure 3 shows the studied bee hives and the measurement set up in the field. The 1.5 m height is a typical height at which such EM field measurements30. Additionally, this height is mentioned in the ECC(02)04 standard31. The purpose of these measurements was to get an overview of which frequency bands were in use at the respective sites. These frequency bands were then investigated further in the second measurements.
Second, the same spectrum analyzer was connected to the tri-axial antenna TS-EMF which was again supported by the same tripod at a height of 1.5 m. The tripod was placed at two distances of 1 and 2 m from the central bee hive. The spectrum analyzer performed root-mean square electric field strength (ERMS) measurements over a measurement period of 6 minutes2 in each of the telecommunication frequency bands identified using the first measurement. Each of the three electric field components (Ex, Ey, Ez) were measured individually. ERMS was then obtained as the square root of the sum of squares of the individual components.
ERMS=E2x+E2y+E2z−−−−−−−−−−−√ERMS=Ex2+Ey2+Ez2(2)
The spectrum analyzer measurements in terms of received power on the antenna were then recalculated using the known antenna factor of the tri-axial antenna to incident root-mean-squared electric field strength. The ERMS,i values in each frequency band (i) were then summed quadratically and the square root of that sum is listed as the total instantaneous electric field strength (ERMS,tot).
ERMS,tot=∑iE2RMS,i−−−−−−−−−√ERMS,tot=∑iERMS,i2(3)
The measurement procedure and measurement settings for these RF-EMF exposure measurements are presented in32. The expanded measurement uncertainty (95% confidence interval) for electric field strength measurements using this set up is ±3 dB30.This measurement setup enables the most accurate assessment of in situ exposure from various RF-EMF sources30.
Third, a broadband exposure measurement was executed using a Narda NBM-550 probe (Narda, Hauppauge,NY, USA) connected to an EF 0691 broad-band probe (Narda, Hauppauge, NY, USA) which has a frequency span from 100 kHz to 6 GHz, thus including so-called intermediate frequencies (IF). These IF fields are not considered in our numerical simulations. However, we measured those to provide a complete overview of the exposure to electromagnetic field below 6 GHz. The NMB probe was placed on top of the central bee hive and was left there during both RF measurements. The device measured and registered root-mean-squared electric field strengths with a period of 1 s. From those time series of measurements, we obtained the time average and the maximal value.
The researchers that executed the RF-EMF field measurements did not use personal devices during the measurements. All wireless devices brought to the measurement site by the researchers were operated in flight mode, i.e. any wireless transmissions by those devices were not allowed.
Estimation of realistic RF-EMF absorbed power in honey bees
Realistic Pabs absorbed in honey bees can be obtained by rescaling the simulated Pabs values using the measured incident field strengths. Therefore, we linearly averaged the total ERMS values measured near the five bee hives at two different positions to obtain an average ERMS,avg value. In order to estimate exposure of honey bees in current wireless networks, we averaged the Pabs values using:
Pabs,av(f<3GHz)=14∑i=14Pabs(fi)Pabs,av(f<3GHz)=14∑i=14Pabs(fi)(4)
with fi = 0.6, 1.2, 2, 3 GHz. We only considered Pabs values < 3 GHz, since our measurements will show that there are only incident RF-EMFs below 3 GHz in the current environment of honey bees in Belgium. This value is then rescaled using:
Pabs,real(f<3GHz)=E2RMS,avg1V2/m2×Pabs,av(f<3GHz)Pabs,real(f<3GHz)=ERMS,avg21V2/m2×Pabs,av(f<3GHz)(5)
In order to estimate the effect of a fraction (p ∈ [0, 1]) of the RF-EMF incident fields shifting to frequencies higher than 3 GHz we also determine the average Pabs for frequencies higher than 3 GHz, using:
Pabs,av(f>3GHz)=15∑j=15Pabs(fj)Pabs,av(f>3GHz)=15∑j=15Pabs(fj)(6)
with fj = 6, 12, 24, 60,120 GHz. The realistic Pabs,real(p) for a fraction p of the power shifted to frequencies higher than 3 GHz is then calculated as:
Pabs,real(p)=p×E2RMS,avg1V2/m2×Pabs,av(f>3GHz)+(1−p)×E2RMS,avg1V2/m2×Pabs,av(f<3GHz)Pabs,real(p)=p×ERMS,avg21V2/m2×Pabs,av(f>3GHz)+(1−p)×ERMS,avg21V2/m2×Pabs,av(f<3GHz)(7)
Results
Numerical simulations
Figure 4 shows the relative electric field strength (electric field strength divided by the maximum electric field strength in the simulation domain) in and around the studied drone in a mid-sagital plane as function of frequency for exposure configuration number 1 shown in Fig. 2. The internal electric fields increase up to 12 GHz and shift towards the outside of the phantom at higher frequencies. At 120 GHz the electric field strengths decreases very rapidly within the phantom and electric fields are basically only present in the outer layers of the insect. This is caused by a decrease in skin depth that is driven by the increase in conductivity at higher frequencies, see Table 1. Note that the total RF-EMF absorbed power in the insect scales both with the internal electric field strength and the conductivity.
Relative electric field strength in and around a mid-sagittal plane of the Honey Bee Drone at the nine studied frequencies. Grey scale shows the electric field strengths relative to 1 V/m electric field strength.
Figure 5 shows the normalized RF-EMF Pabs as a function of frequency for the five studied insects from 0.6 GHz up to 120 GHz. The curves connect the linear averages of the 12 Pabs values obtained for each honey bee at each simulated frequency, while the whiskers indicate the minimum and maximum Pabs values found at those frequencies. All Pabs values are normalized to an incident field strength of 1 V/m. Figure 5 shows an increase of Pabs over frequency for all studied phantoms up to 6 GHz. When comparing the average Pabs at 0.6 GHz and 6 GHz, we found relative increases of factors of 16, 35, 72, 121, and 54 for the Worker Bee 1, Worker Bee 2, Drone, Larva, and queen Bee, respectively. The Pabs slightly decreases over frequency beyond 12 GHz for all the studied honey bees. When comparing Pabs at 12 GHz and 120 GHz, we found relative decreases of 26%, 34%, 33%, 32%, and 34% for the Worker Bee 1, Worker Bee 2, Drone, Larva, and Queen Bee, respectively. The spread on the Pabs values obtained at each individual frequency reduces from up to a factor of 13 below 12 GHz to smaller than a factor 2.5 beyond 12 GHz. Figure 5 shows a general increase of Pabs with increasing volume and surface area of the studied insects. Previous studies on whole-body averaged absorbed RF power and specific absorption rate of humans have shown a dependency of these quantities on the absorption cross section, a quantity that scales with volume and/or surface area of an exposed subject. When the diagonals of the smallest rectangular brick that contain the insect phantoms are considered, the honey bee with the smallest diagonal, Worker Bee 1 with a diagonal of 13 mm has the overall lowest average Pabs. The Larva, Queen Bee, and Drone all have associated diagonals of 22 mm and have similar average Pabs values as function of frequency. The Worker Bee 2 has a diagonal that falls in between Worker 1 and the other insects of 16 mm and also has an average Pabs that falls in between the curve for the smaller worker and the other honey bee models, see Fig. 5. We attribute he differences between the two Worker Bee phantoms mainly to the difference in size of both phantoms. The larger Worker Bee 2 phantom has a larger diagonal, surface area, and volume. This leads to a higher absorption cross section33 and higher Pabs.
Total absorbed power (Pabs) in the five studied honey bees as function of frequency, normalized to an incident plane-wave field strength of 1 V/m at each frequency. The curves indicate the mean values over the twelve plane wave simulations, while the whiskers indicate the maximum and minimum values found at each frequency. The whiskers are slightly offset in order to avoid visual overlap but are all determined at the simulated frequencies described in the Methods Section.
The maximal Pabs for the five studied insect models occurs at those wavelengths that are close to the double of this diagonal, which suggests an absorption peak around half a wavelength. The maximum Pabs for the Larva model lies in between 3 and 12 GHz, i.e. in between 25 and 100 mm in terms of λ, while the diagonal of said bounding box is 22 mm for the phantom. For the other studied insect models the maximum Pabs lies in between 6 and 24 GHz, i.e. in between 23 and 50 mm in terms of λ, with associated phantom diagonals ranging from 16 mm to 22 mm.
<p style="padding:0px;margin:0px 0
Leave a comment
Log in to post comments
Latest comments